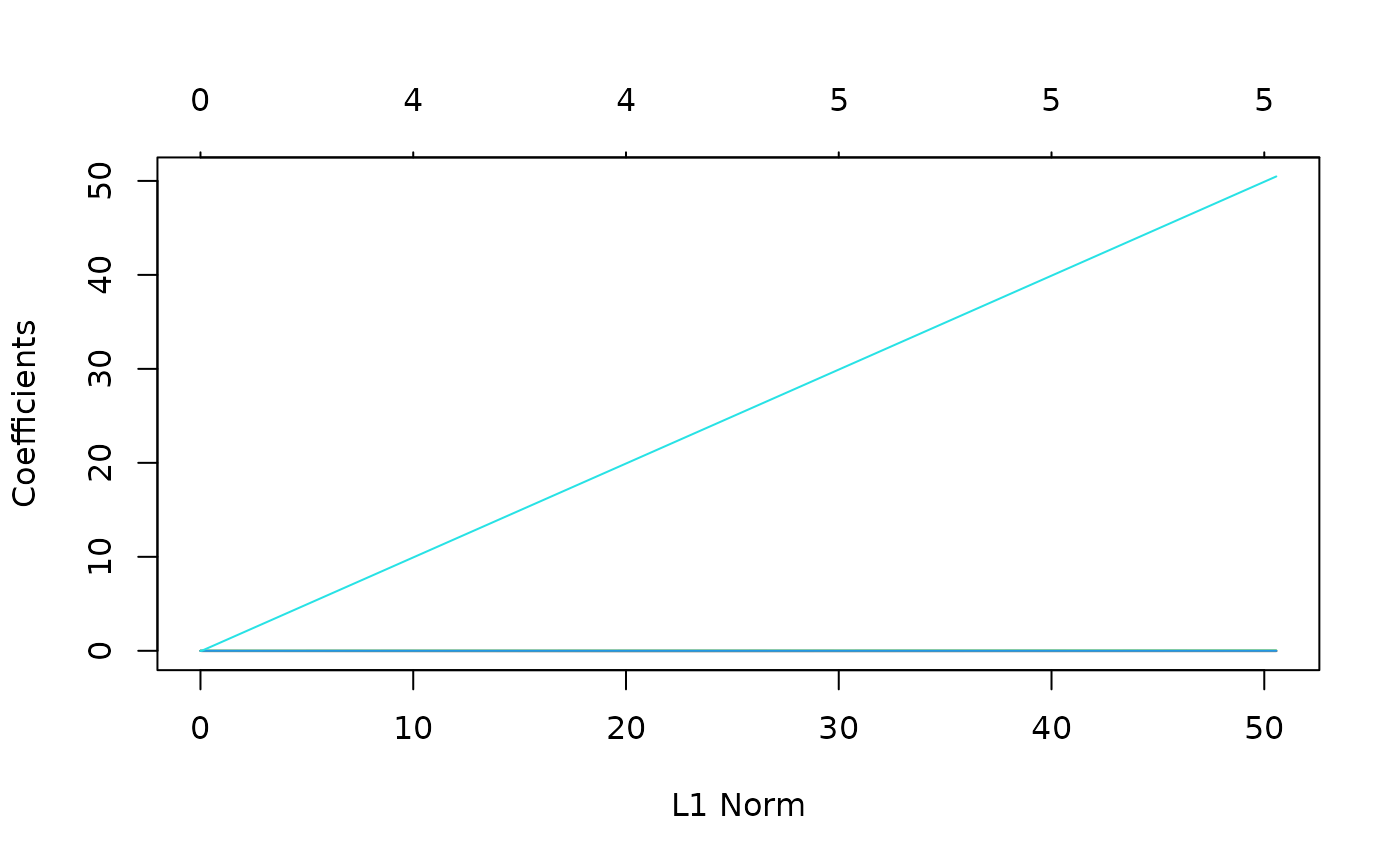
Plots the glide path for the coefficients for a PrestoGP model.
Source:R/PrestoGP_Model.R
plot_beta-PrestoGPModel-method.RdThis method generates a plot showing the coefficients of the model for
different values of the tuning parameter. It is a wrapper for
plot.glmnet or plot.ncvreg.
Arguments
- model
The PrestoGP model object
- ...
Additional parameters to
plot.glmnetorplot.ncvreg.
References
Messier, K.P. and Katzfuss, M. "Scalable penalized spatiotemporal land-use regression for ground-level nitrogen dioxide", The Annals of Applied Statistics (2021) 15(2):688-710.
Examples
data(soil)
soil <- soil[!is.na(soil[,5]),] # remove rows with NA's
y <- soil[,4]                   # predict moisture content
X <- as.matrix(soil[,5:9])
locs <- as.matrix(soil[,1:2])

soil.vm <- new("VecchiaModel", n_neighbors = 10)
soil.vm <- prestogp_fit(soil.vm, y, X, locs)
#>
#> Estimating initial beta...
#> Estimation of initial beta complete
#>
#> Beginning iteration 1
#> Estimating theta...
#> Estimation of theta complete
#> Estimating beta...
#> Estimation of beta complete
#> Iteration 1 complete
#> Current penalized negative log likelihood: 487.4483
#> Current MSE: 9.104869
#> Beginning iteration 2
#> Estimating theta...
#> Estimation of theta complete
#> Estimating beta...
#> Estimation of beta complete
#> Iteration 2 complete
#> Current penalized negative log likelihood: 481.5807
#> Current MSE: 9.046003
#> Beginning iteration 3
#> Estimating theta...
#> Estimation of theta complete
#> Estimating beta...
#> Estimation of beta complete
#> Iteration 3 complete
#> Current penalized negative log likelihood: 481.5569
#> Current MSE: 9.042988
#> Beginning iteration 4
#> Estimating theta...
#> Estimation of theta complete
#> Estimating beta...
#> Estimation of beta complete
#> Iteration 4 complete
#> Current penalized negative log likelihood: 481.5156
#> Current MSE: 9.041133
#> Beginning iteration 5
#> Estimating theta...
#> Estimation of theta complete
#> Estimating beta...
#> Estimation of beta complete
#> Iteration 5 complete
#> Current penalized negative log likelihood: 481.5156
#> Current MSE: 9.046331
plot_beta(soil.vm)
