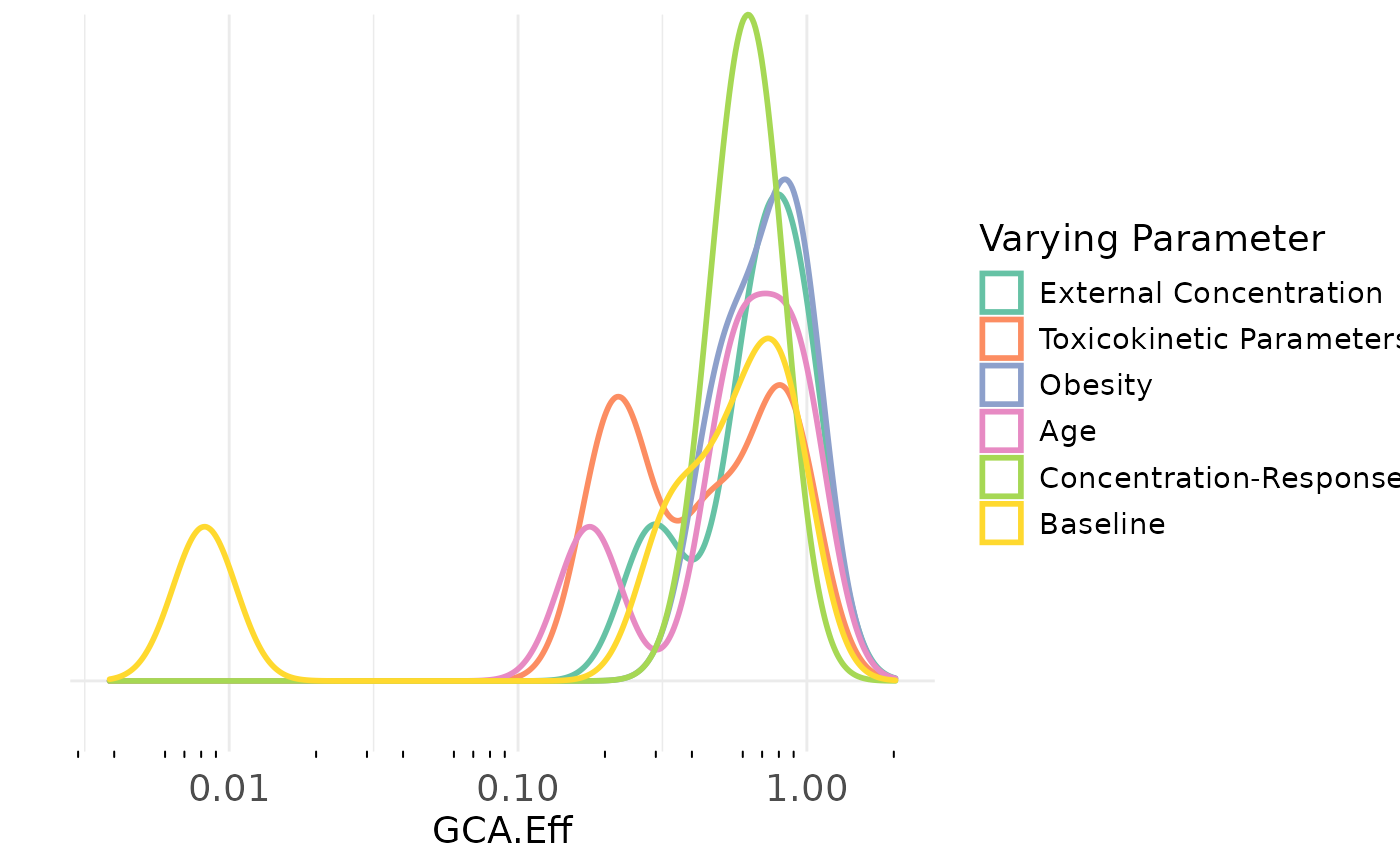
Plot results of sensitivity analysis.
Examples
# Required GeoTox fields are generated by first running [calculate_response]
# and [sensitivity_analysis] on a GeoTox object. This will create the fields
# `resp` and `sensitivity`. For this example, dummy data will be used.
make_data <- function(n = 5, metric = "GCA.Eff") {
  list(stats::setNames(data.frame(1:n, runif(n)),
                       c("sample", metric)))
}

geoTox <- GeoTox()
geoTox$resp <- make_data()
geoTox$sensitivity <- list(age = make_data(),
                           obesity = make_data(),
                           css_params = make_data(),
                           fit_params = make_data(),
                           C_ext = make_data())

plot_sensitivity(geoTox)
#> Picking joint bandwidth of 0.188
